Market Outlook
January 23, 2017
Market Cues
Domestic Indices
Chg (%)
(Pts)
(Close)
Indian markets are likely to open flat with a negative bias tracking SGX Nifty.
BSE Sensex
(1.0)
(274)
27,035
U.S. markets closed higher on Friday in a modest but broad-based advance as
Nifty
(1.0)
(86)
8,349
Donald Trump was sworn in as U.S. President, marking the first time in more than
Mid Cap
(1.5)
(197)
12,584
50 years that a new commander-in-chief has been welcomed by a rising equity
Small Cap
(1.3)
(165)
12,761
market on his first day in office.
Bankex
(1.8)
(388)
21,540
The majority of the European markets ended Friday's session with modest gains. A
number of investors remained on the sidelines at the end of the trading week, as
investors watch the transition of power in the United States.
Global Indices
Chg (%)
(Pts)
(Close)
Dow Jones
0.5
95
19,827
Indian market tumbled on Friday after two straight sessions of gains, with
disappointing third-quarter earnings from the likes of Axis Bank and MindTree as
Nasdaq
0.3
15
5,555
well as lackluster global cues ahead of U.S. President-elect Donald Trump's
FTSE
(0.1)
(10)
7,198
inauguration weighing on markets.
Nikkei
0.3
66
19,138
Hang Seng
(0.7)
(164)
22,886
News Analysis
Shanghai Com
0.7
22
3,123
Review: RBL
Detailed analysis on Pg2
Advances / Declines
BSE
NSE
Investor’s Ready Reckoner
Advances
823
374
Key Domestic & Global Indicators
Declines
1,903
1,265
Stock Watch: Latest investment recommendations on 150+ stocks
Unchanged
189
70
Refer Pg6 onwards
Top Picks
Volumes (` Cr)
CMP
Target
Upside
Company
Sector
Rating
BSE
2,575
(`)
(`)
(%)
Amara Raja Batteries Auto & Auto Ancillary
Buy
902
1,167
29.3
NSE
19,975
Alkem Laboratories
Pharmaceuticals
Buy
1,646
1,989
20.9
HCL Tech
IT
Buy
839
1,000
19.3
Net Inflows (` Cr)
Net
Mtd
Ytd
Power Grid Corp.
Power
Accumulate
199
223
12.0
FII
474
(2,576)
(2,576)
Navkar Corp.
Others
Buy
176
265
50.2
MFs
178
2,652
2,652
More Top Picks on Pg4
Key Upcoming Events
Top Gainers
Price (`)
Chg (%)
Previous
Consensus
Date
Region
Event Description
Havells
402
4.0
Reading
Expectations
Idea
71
3.0
Jan 23 Euro Zone Euro-Zone Consumer Confidence
(4.80)
(4.80)
Jan 24 Germany PMI Services
54.30
54.50
Jswenergy
61
2.1
Jan 24 Germany PMI Manufacturing
55.60
55.40
Unitdspr
2,078
1.6
Jan 24 US
Existing home sales
5.61
5.50
Cub
142
1.4
Jan 26 US
Initial Jobless claims
234.00
247.00
More Events on Pg5
Top Losers
Price (`)
Chg (%)
Adanipower
34
(11.5)
Sintex
83
(7.3)
Mrpl
101
(7.1)
Axisbank
451
(6.9)
Jisljaleqs
89
(5.9)
As on January 21, 2017
Market Outlook
January 23, 2017
New Analysis
RBL Bank Q3 net up 59% to `129cr on higher net interest income
Private sector lender, RBL Bank has reported a 59% jump in its net profit in the
October-December quarter to `129cr on the back of higher net interest income
and other income.
Net interest income, the difference between interest earned and interest expended,
increased by 45%. Even the other income which includes fees, commissions etc
improved by 66% to `182.3cr at the end of quarter ended December.
The bank's asset quality improved slightly. At the end of quarter ended December,
the gross Non Performing Assets was at 1.06 per cent as compared to 1.08 per
cent in the same quarter a year ago. The net NPA ratio also improved to 0.52 per
cent as compared to 0.69 per cent in the same quarter a year ago.
Net interest margin, a key indicator of bank's profitability increased to 3.38 per
cent as compared to 3.24 per cent in the same quarter last financial year.
According to bank its cost to income ratio has improved, however, it still remains
high at 53%. The bank remains well capitalized with a capital adequacy ratio of
13.8%.
Economic and Political News
RBI working on plan to reduce online charges: Patel tells PAC
Railways seeks gross budgetary support of `50,000cr for FY18
Banks to report cash payments, credit card bills of `1lakh to I-T
Corporate News
Ambuja Cements to challenge CCI penalty in COMPAT
Adani Power Q3 net loss at `325cr
Canara Bank Q3 profit up 3-fold at `322cr
Quarterly Bloomberg Brokers Consensus Estimate
Power Finance Corp Ltd. - Jan 23, 2017
Particulars ( ` cr)
3QFY17E
3QFY16
y-o-y (%)
2QFY17 q-o-q (%)
PAT
1,775
1,582
12.2
1,873
(5.3)
Idea Cellular Ltd Consol - Jan 23, 2017
Particulars ( ` cr)
3QFY17E
3QFY16
y-o-y (%)
2QFY17 q-o-q (%)
Net sales
9,350
9,001
3.9
9,299
0.5
EBITDA
3,015
3,129
(3.6)
2,840
6.2
EBITDA margin (%)
32.2
34.8
30.5
Net profit
185
764
(75.8)
91
102.3
Market Outlook
January 23, 2017
Hindustan Unilever Ltd - Jan 23, 2017
Particulars ( ` cr)
3QFY17E
3QFY16
y-o-y (%)
2QFY17
q-o-q (%)
Net sales
7,964
7,823
1.8
7,698
3.5
EBITDA
1,456
1,431
1.8
1,405
3.7
EBITDA margin (%)
18.3
18.3
18.2
Net profit
1,062
971
9.3
1,107
(4.1)
Asian Paints Ltd Consol - Jan 23, 2017
Particulars ( ` cr)
3QFY17E
3QFY16
y-o-y (%)
2QFY17
q-o-q (%)
Net sales
4,122
4,103
0.5
3,721
10.8
EBITDA
763
801
(4.6)
713
7.1
EBITDA margin (%)
18.5
19.5
19.2
Net profit
494
516
(4.3)
493
0.1
HCL Technologies Ltd Consol - Jan 24, 2017
Particulars ( ` cr)
3QFY17E
3QFY16
y-o-y (%)
2QFY17
q-o-q (%)
Net sales
11,226
10,097
11.2
10,698
4.9
EBITDA
2,363
2,092
13.0
2,379
(0.7)
EBITDA margin (%)
21.1
20.7
22.2
Net profit
1,900
1,740
9.2
1,926
(1.3)
HDFC Bank Ltd. - Jan 24, 2017
Particulars ( ` cr)
3QFY17E
3QFY16
y-o-y (%)
2QFY17
q-o-q (%)
PAT
3,451
3,357
2.8
3,455
(0.1)
Bharti Airtel Ltd Consol - Jan 24, 2017
Particulars ( ` cr)
3QFY17E
3QFY16
y-o-y (%)
2QFY17
q-o-q (%)
Net sales
24,569
24,066
2.1
24,652
(0.3)
EBITDA
9,061
8,445
7.3
9,460
(4.2)
EBITDA margin (%)
36.9
35.1
38.4
Net profit
1,253
1,117
12.2
1,465
(14.5)
Market Outlook
January 23, 2017
Top Picks ★★★★★
Large Cap
Market Cap
CMP
Target
Upside
Company
Rationale
(` Cr)
(`)
(`)
(%)
To outpace battery industry growth due to better
Amara Raja Batteries
15,413
902
1,167
29.3
technological products leading to market share gains in both
the automotive OEM and replacement segments.
Strong growth in domestic business due to its leadership in
Alkem Laboratories
19,674
1,646
1,989
20.9
acute therapeutic segment. Alkem expects to launch more
products in USA, which bodes for its international business.
The stock is trading at attractive valuations and is factoring
HCL Tech
1,18,329
839
1,000
19.3
all the bad news.
Back on the growth trend, expect a long term growth of 14%
Infosys
2,17,934
949
1,249
31.6
to be a US$20bn in FY2020.
Strong order backlog and improvement in execution would
Larsen & Toubro
1,31,932
1,415
1,634
15.5
trigger the growth for the L&T
One of the largest pharma companies with strong
Lupin
65,987
1,462
1,809
23.8
international presence. It has a rich pipeline of ANDAs which
is also one of the largest among the generic companies.
Going forward, we expect the company to report strong top-
Power Grid Corporation
1,04,135
199
223
12.0
line CAGR of ~16% and bottom-line CAGR of ~19% over
FY16-18 on back of strong capitalization guidance
Source: Company, Angel Research
Mid Cap
Market Cap
CMP
Target
Upside
Company
Rationale
(` Cr)
(`)
(`)
(%)
We expect the company would report strong profitability
Asian Granito
761
253
351
38.8
owing to better product mix, higher B2C sales and
amalgamation synergy.
Among the top 4 players in the consumer durables segment.
Bajaj Electricals
2,308
228
274
20.0
Improved profitability backed by turn around in E&P segment.
Strong order book lends earnings visibility.
Favourable outlook for the AC industry to augur well for
Cooling products business which is out pacing the market
Blue Star
4,919
515
634
23.1
growth. EMPPAC division's profitability to improve once
operating environment turns around.
With a focus on the low and medium income (LMI) consumer
Dewan Housing Finance
8,530
272
350
28.5
segment, the company has increased its presence in tier-II &
III cities where the growth opportunity is immense.
Strong loan growth backed by diversified loan portfolio and
Equitas Holdings
5,311
158
235
48.4
adequate CAR. ROE & ROA likely to remain decent as risk of
dilution remains low. Attractive valuations considering growth.
Economic recovery to have favourable impact on advertising
& circulation revenue growth. Further, the acquisition of a
Jagran Prakashan
5,821
178
225
26.4
radio business (Radio City) would also boost the company's
revenue growth.
High order book execution in EPC segment, rising B2C sales
KEI Industries
1,054
136
153
12.9
and higher exports to boost the revenues and profitability
Speedier execution and speedier sales, strong revenue visibilty
Mahindra Lifespace
1,478
360
522
44.9
in short-to-long run, attractive valuations
Higher growth in domestic branded sales and healthy export
Mirza International
1,086
90
107
18.5
to boost the profitability.
Massive capacity expansion along with rail advantage at ICD
Navkar Corporation
2,516
176
265
50.2
as well CFS augurs well for the company
Strong brands and distribution network would boost growth
Siyaram Silk Mills
1,300
1,387
1,605
15.7
going ahead. Stock currently trades at an inexpensive
valuation.
Market leadership in Hindi news genre and no. 2 viewership
ranking in English news genre, exit from the radio business,
TV Today Network
1,642
275
385
39.8
and anticipated growth in ad spends by corporates to benefit
the stock.
Source: Company, Angel Research
Market Outlook
January 23, 2017
Key Upcoming Events
Result Calendar
Date
Company
January 23, 2017
HUL
M&M, TVS Motor, HDFC Bank, IDBI Bank, IOB, Asian Paints, HCL Tech, HT Media, Heritage Foods,
January 24, 2017
Nilkamal
United Phosphorus, Maruti, Exide Industries, Ashok Leyland, Blue Star, Kotak Mah. Bank, Indian Bank,
January 25, 2017
Wipro, Kirloskar Engines India Ltd, Alembic Pharma, VRL Logistics
January 27, 2017
India Cements, ITC, Colgate, Indoco Remedies
Source: Bloomberg, Angel Research
Global economic events release calendar
Bloomberg Data
Date
Time
Country
Event Description
Unit
Period
Last Reported
Estimated
Jan 23, 2017
8:30 PM Euro Zone
Euro-Zone Consumer Confidence
Value Jan A
(4.80)
(4.80)
Jan 24, 2017
2:00 PM Germany
PMI Services
Value Jan P
54.30
54.50
2:00 PM Germany
PMI Manufacturing
Value Jan P
55.60
55.40
8:30 PM
US
Existing home sales
Million
Dec
5.61
5.50
Jan 26, 2017
7:00 PM
US
Initial Jobless claims
Thousands Jan 21
234.00
247.00
7:00 PM
US
GDP Qoq (Annualised)
% Change 4Q A
3.50
2.20
3:00 PM
UK
GDP (YoY)
% Change 4Q A
2.20
2.10
Jan 27, 2017
8:30 PM
US
New home sales
Thousands Dec
592.00
586.00
Jan 31, 2017
2:25 PM Germany
Unemployment change (000's)
Thousands Jan
(17.00)
8:30 PM
US
Consumer Confidence S.A./ 1985=100 Jan
113.70
113.00
3:30 PM Euro Zone
Euro-Zone GDP s.a. (QoQ)
% Change 4Q A
0.30
Feb 01, 2017
3:00 PM
UK
PMI Manufacturing
Value Jan
56.10
6:30 AM
China
PMI Manufacturing
Value Jan
51.40
Feb 02, 2017
5:30 PM
UK
BOE Announces rates
% Ratio Feb 2
0.25
12:30 AM
US
FOMC rate decision
% Feb 1
0.75
0.75
Feb 03, 2017
7:00 PM
US
Change in Nonfarm payrolls
Thousands Jan
156.00
160.00
7:00 PM
US
Unnemployment rate
% Jan
4.70
4.70
Feb 08, 2017
2:30 PM
India
RBI Repo rate
% Feb 8
6.25
2:30 PM
India
RBI Reverse Repo rate
% Feb 8
5.75
2:30 PM
India
RBI Cash Reserve ratio
% Feb 8
4.00
Source: Bloomberg, Angel Research
Market Outlook
January 23, 2017
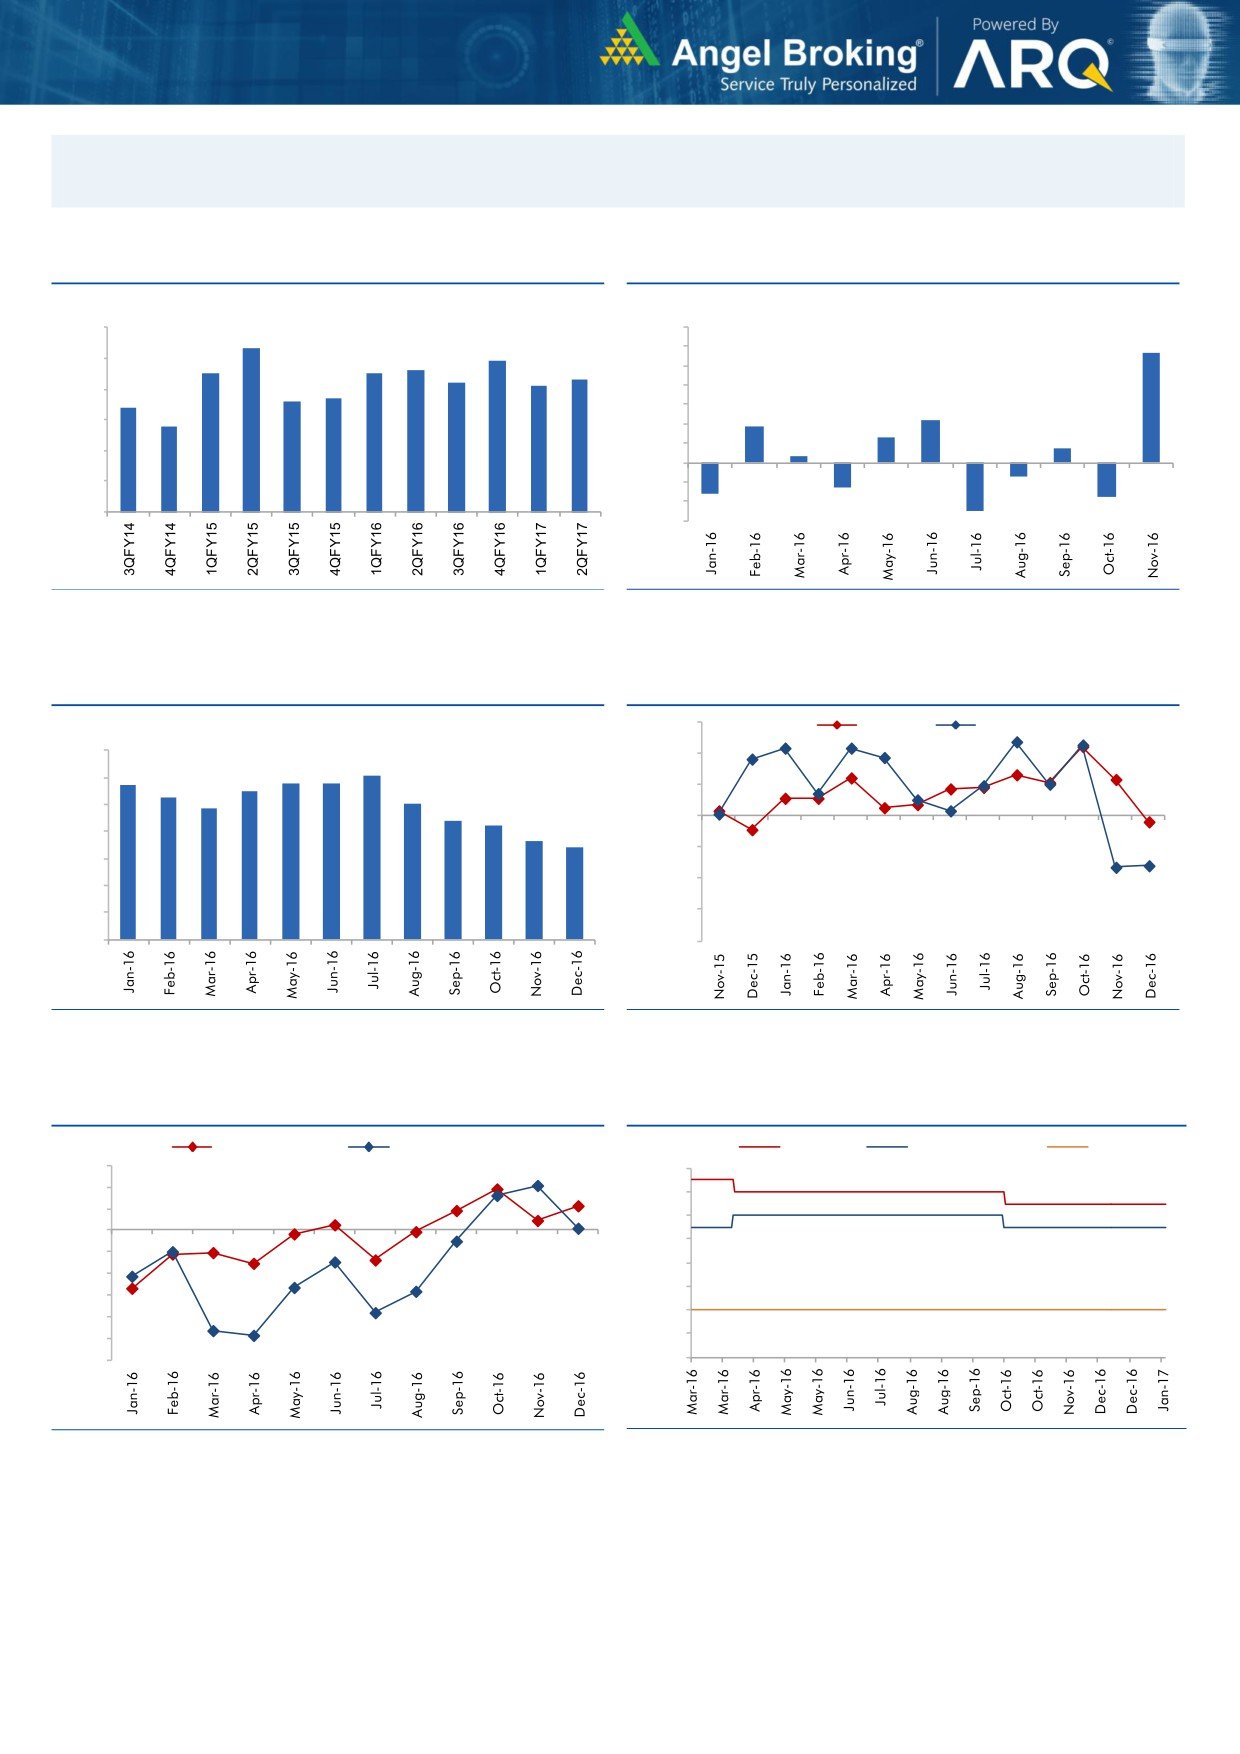
Macro watch
Exhibit 1: Quarterly GDP trends
Exhibit 2: IIP trends
(%)
(%)
9.0
8.3
7.0
5.7
7.9
6.0
8.0
7.5
7.5
7.6
7.3
5.0
7.2
7.1
6.6
6.7
4.0
7.0
6.4
3.0
2.2
5.8
1.9
6.0
2.0
1.3
0.7
1.0
0.3
5.0
-
4.0
(1.0)
(0.7)
(2.0)
(1.3)
3.0
(1.6)
(1.8)
(3.0)
(2.5)
Source: CSO, Angel Research
Source: MOSPI, Angel Research
Exhibit 3: Monthly CPI inflation trends
Exhibit 4: Manufacturing and services PMI
56.0
Mfg. PMI
Services PMI
(%)
7.0
54.0
6.1
5.7
5.8
5.8
6.0
5.3
5.5
5.1
52.0
4.8
5.0
4.4
4.2
50.0
4.0
3.6
3.4
48.0
3.0
46.0
2.0
1.0
44.0
-
42.0
Source: MOSPI, Angel Research
Source: Market, Angel Research; Note: Level above 50 indicates expansion
Exhibit 5: Exports and imports growth trends
Exhibit 6: Key policy rates
(%)
Exports yoy growth
Imports yoy growth
(%)
Repo rate
Reverse Repo rate
CRR
15.0
7.00
10.0
6.50
5.0
6.00
0.0
5.50
(5.0)
5.00
(10.0)
4.50
(15.0)
4.00
(20.0)
3.50
(25.0)
(30.0)
3.00
Source: Bloomberg, Angel Research
Source: RBI, Angel Research
Market Outlook
January 23, 2017
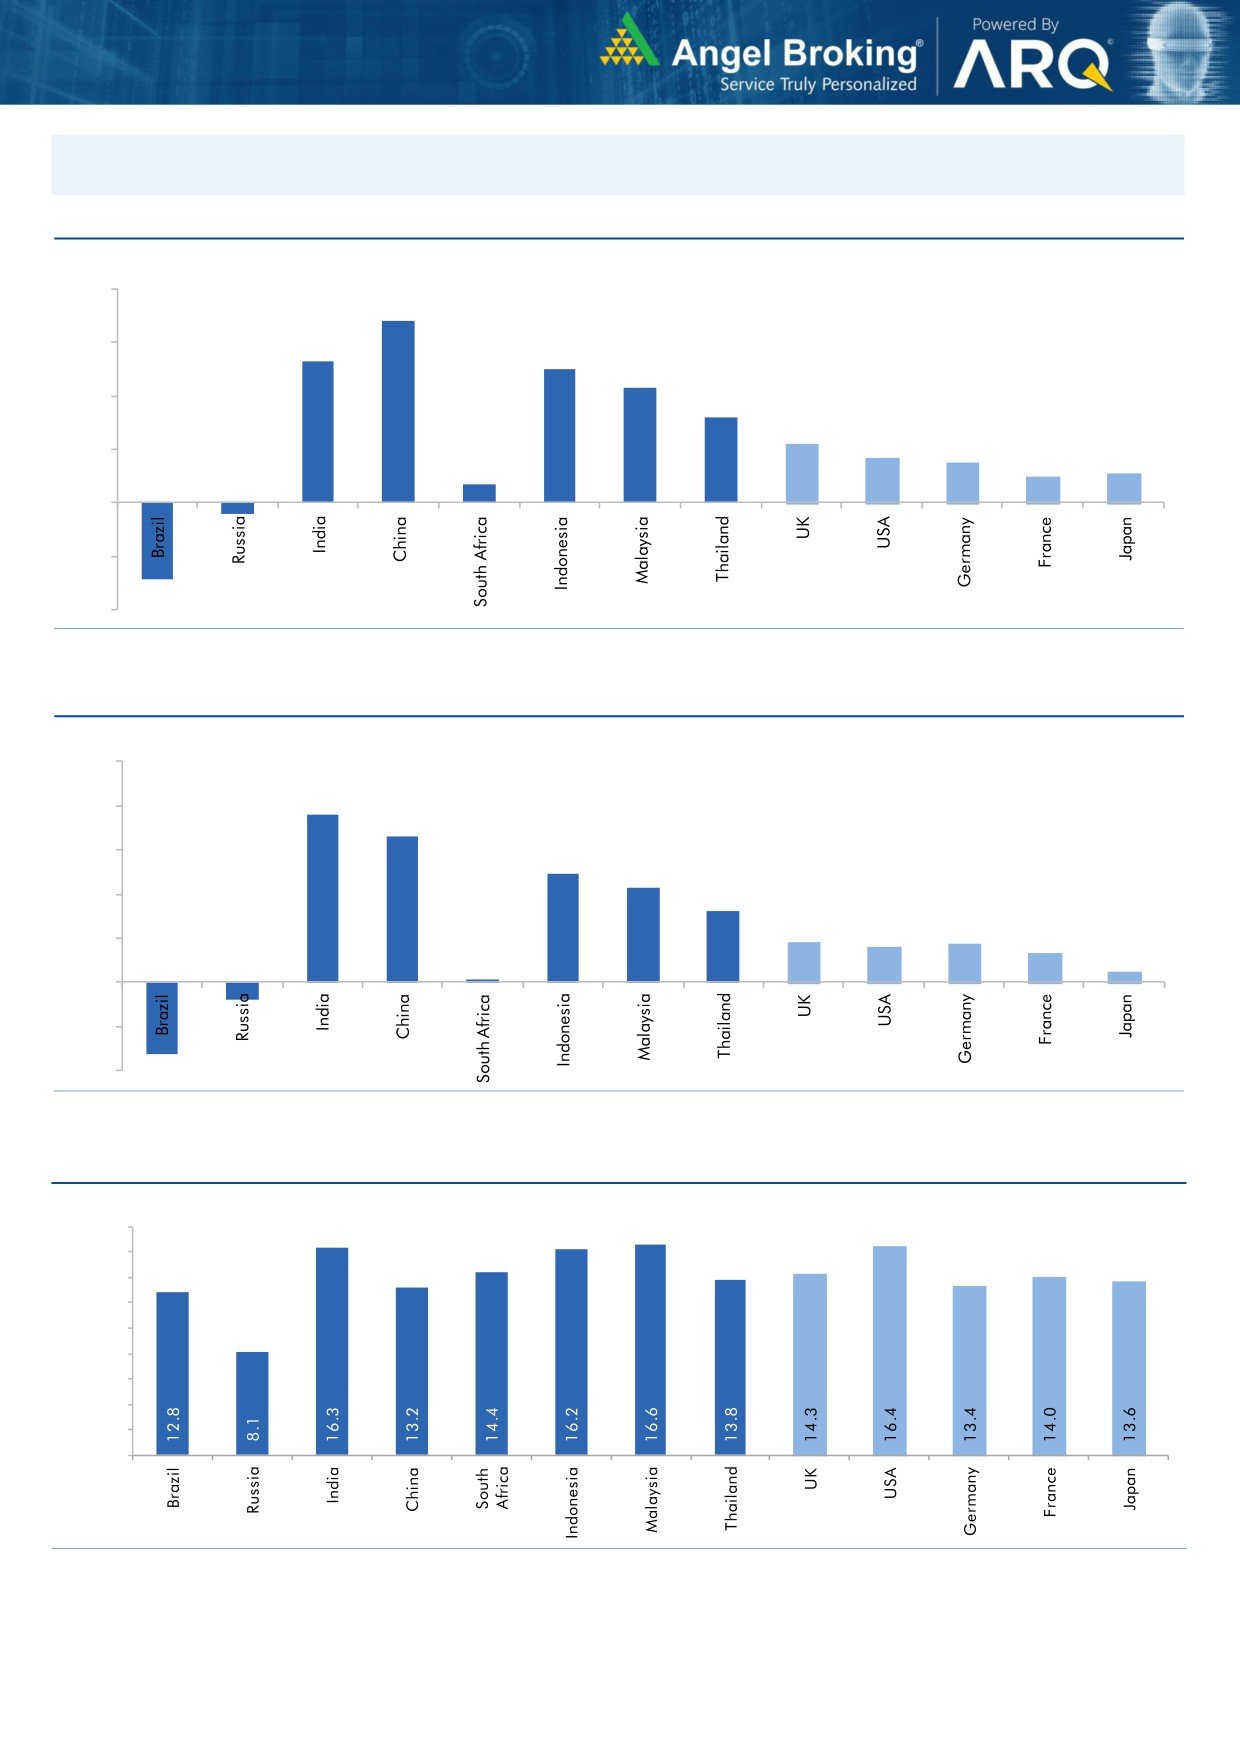
Global watch
Exhibit 1: Latest quarterly GDP Growth (%, yoy) across select developing and developed countries
(%)
8.0
6.8
5.3
6.0
5.0
0.7
4.3
4.0
3.2
2.2
1.7
1.5
2.0
1.0
1.1
-
(2.0)
(0.4)
(2.9)
(4.0)
Source: Bloomberg, Angel Research
Exhibit 2: 2016 GDP Growth projection by IMF (%, yoy) across select developing and developed countries
(%)
10.0
7.6
8.0
6.6
6.0
4.9
4.3
4.0
3.2
1.8
1.6
1.7
2.0
1.3
(0.8)
0.5
(3.3)
0.1
-
(2.0)
(4.0)
Source: IMF, Angel Research
Exhibit 3: One year forward P-E ratio across select developing and developed countries
(x)
18.0
16.0
14.0
12.0
10.0
8.0
6.0
4.0
2.0
-
Source: IMF, Angel Research
Market Outlook
January 23, 2017
Exhibit 4: Relative performance of indices across globe
Returns (%)
Country
Name of index
Closing price
1M
3M
1YR
Brazil
Bovespa
64,521
12.0
1.6
71.4
Russia
Micex
2,160
(3.0)
10.4
25.8
India
Nifty
8,349
3.6
(4.0)
12.3
China
Shanghai Composite
3,123
0.7
1.0
3.3
South Africa
Top 40
45,781
6.1
2.8
6.8
Mexico
Mexbol
46,332
3.0
(4.5)
11.7
Indonesia
LQ45
876
1.2
(6.0)
11.3
Malaysia
KLCI
1,665
1.9
(0.2)
1.9
Thailand
SET 50
973
2.6
3.5
26.4
USA
Dow Jones
19,827
(0.1)
9.2
23.2
UK
FTSE
7,198
2.7
2.5
22.5
Japan
Nikkei
19,138
(0.7)
13.5
11.1
Germany
DAX
11,630
1.4
8.6
20.6
France
CAC
4,851
0.0
6.9
10.4
Source: Bloomberg, Angel Research
Stock Watch
January 23, 2017
Company Name
Reco
CMP
Target
Mkt Cap
Sales ( Čcr )
OPM(%)
EPS (Č)
PER(x)
P/BV(x)
RoE(%)
EV/Sales(x)
(Č)
Price ( Č)
( Č cr )
FY17E FY18E
FY17E
FY18E
FY17E
FY18E
FY17E
FY18E
FY17E
FY18E
FY17E
FY18E
FY17E
FY18E
Agri / Agri Chemical
Rallis
Neutral
209
-
4,062
1,937
2,164
13.3
14.3
9.0
11.0
23.2
19.0
4.0
3.5
18.4
19.8
2.1
1.9
United Phosphorus
Neutral
733
-
37,154
15,176
17,604
18.5
18.5
37.4
44.6
19.6
16.4
3.8
3.2
21.4
21.2
2.6
2.2
Auto & Auto Ancillary
Ashok Leyland
Buy
86
111
24,389
22,407
26,022
10.6
10.6
5.2
6.4
16.4
13.4
3.7
3.1
23.6
24.7
1.2
1.0
Bajaj Auto
Neutral
2,698
-
78,081
25,093
27,891
19.5
19.2
143.9
162.5
18.8
16.6
5.3
4.5
30.3
29.4
2.8
2.5
Bharat Forge
Neutral
924
-
21,509
7,726
8,713
20.5
21.2
35.3
42.7
26.2
21.6
4.8
4.4
18.9
20.1
2.8
2.5
Eicher Motors
Neutral
22,789
-
61,995
16,583
20,447
17.5
18.0
598.0
745.2
38.1
30.6
13.0
9.9
41.2
38.3
3.6
2.8
Gabriel India
Buy
109
130
1,565
1,544
1,715
9.0
9.3
5.4
6.3
20.2
17.3
3.8
3.4
18.9
19.5
1.0
0.9
Hero Motocorp
Buy
3,057
3,541
61,038
30,958
34,139
15.7
15.7
193.6
208.3
15.8
14.7
6.2
5.1
34.2
30.5
1.8
1.6
Jamna Auto Industries Neutral
186
-
1,477
1,486
1,620
9.8
9.9
15.0
17.2
12.4
10.8
2.7
2.3
21.8
21.3
1.1
1.0
L G Balakrishnan & Bros Neutral
560
-
879
1,302
1,432
11.6
11.9
43.7
53.0
12.8
10.6
1.8
1.6
13.8
14.2
0.8
0.7
Mahindra and Mahindra Neutral
1,192
-
74,012
46,534
53,077
11.6
11.7
67.3
78.1
17.7
15.3
2.9
2.5
15.4
15.8
1.6
1.3
Maruti
Accumulate
5,672
6,006
171,344
68,057
82,958
15.8
15.5
212.1
261.2
26.7
21.7
5.3
4.4
19.8
20.3
2.2
1.7
Minda Industries
Neutral
344
-
2,727
2,728
3,042
9.0
9.1
68.2
86.2
5.0
4.0
1.1
0.9
23.8
24.3
1.1
0.9
Motherson Sumi
Neutral
326
-
45,807
45,896
53,687
7.8
8.3
13.0
16.1
25.0
20.3
8.1
6.4
34.7
35.4
1.1
0.9
Rane Brake Lining
Neutral
960
-
760
511
562
11.3
11.5
28.1
30.9
34.2
31.1
5.2
4.7
15.3
15.0
1.6
1.5
Setco Automotive
Neutral
37
-
490
741
837
13.0
13.0
15.2
17.0
2.4
2.2
0.4
0.4
15.8
16.3
1.0
1.0
Tata Motors
Neutral
523
-
151,044
300,209
338,549
8.9
8.4
42.7
54.3
12.3
9.6
2.0
1.7
15.6
17.2
0.6
0.5
TVS Motor
Neutral
379
-
17,992
13,390
15,948
6.9
7.1
12.8
16.5
29.7
22.9
7.4
5.8
26.3
27.2
1.4
1.1
Amara Raja Batteries
Buy
902
1,167
15,413
5,504
6,605
17.6
17.5
33.4
40.9
27.0
22.1
6.0
4.8
22.1
22.0
2.8
2.3
Exide Industries
Neutral
195
-
16,533
7,439
8,307
15.0
15.0
8.1
9.3
24.0
20.9
3.4
3.0
14.3
16.7
1.8
1.6
Apollo Tyres
Buy
184
235
9,351
12,877
14,504
14.3
13.9
21.4
23.0
8.6
8.0
1.3
1.2
16.4
15.2
0.9
0.8
Ceat
Buy
1,175
1,450
4,751
7,524
8,624
13.0
12.7
131.1
144.3
9.0
8.1
1.7
1.4
19.8
18.6
0.7
0.6
JK Tyres
Neutral
127
-
2,875
7,455
8,056
15.0
15.0
21.8
24.5
5.8
5.2
1.2
1.0
22.8
21.3
0.5
0.4
Swaraj Engines
Neutral
1,361
-
1,690
660
810
15.2
16.4
54.5
72.8
25.0
18.7
7.8
7.1
31.5
39.2
2.4
1.9
Subros
Neutral
180
-
1,078
1,488
1,681
11.7
11.9
6.4
7.2
28.1
25.1
3.0
2.7
10.8
11.4
1.0
0.8
Indag Rubber
Neutral
180
-
472
286
326
19.8
16.8
11.7
13.3
15.4
13.5
2.6
2.4
17.8
17.1
1.3
1.2
Capital Goods
ACE
Neutral
47
-
464
709
814
4.1
4.6
1.4
2.1
33.5
22.3
1.4
1.3
4.4
6.0
0.8
0.7
BEML
Neutral
1,159
-
4,825
3,451
4,055
6.3
9.2
31.4
57.9
36.9
20.0
2.2
2.0
6.3
10.9
1.5
1.3
Bharat Electronics
Neutral
1,475
-
32,944
8,137
9,169
16.8
17.2
58.7
62.5
25.1
23.6
3.9
3.5
44.6
46.3
3.0
2.7
Stock Watch
January 23, 2017
Company Name
Reco
CMP
Target
Mkt Cap
Sales ( Čcr )
OPM(%)
EPS (Č)
PER(x)
P/BV(x)
RoE(%)
EV/Sales(x)
(Č)
Price ( Č)
( Č cr )
FY17E
FY18E
FY17E
FY18E
FY17E
FY18E
FY17E
FY18E
FY17E
FY18E
FY17E
FY18E
FY17E
FY18E
Capital Goods
Voltas
Buy
343
407
11,336
6,511
7,514
7.9
8.7
12.9
16.3
26.6
21.0
4.8
4.2
16.7
18.5
1.5
1.3
BGR Energy
Neutral
133
-
956
16,567
33,848
6.0
5.6
7.8
5.9
17.0
22.5
1.0
0.9
4.7
4.2
0.2
0.1
BHEL
Neutral
129
-
31,599
28,797
34,742
-
2.8
2.3
6.9
56.1
18.7
1.0
0.9
1.3
4.8
0.8
0.5
Blue Star
Buy
515
634
4,919
4,283
5,077
5.9
7.3
14.9
22.1
34.6
23.3
6.7
5.7
20.4
26.4
1.2
1.0
Crompton Greaves
Neutral
63
-
3,955
5,777
6,120
5.9
7.0
3.3
4.5
19.1
14.0
0.8
0.8
4.4
5.9
0.6
0.5
Greaves Cotton
Neutral
132
-
3,230
1,755
1,881
16.8
16.9
7.8
8.5
17.0
15.6
3.4
3.2
20.6
20.9
1.5
1.4
Inox Wind
Neutral
189
-
4,195
5,605
6,267
15.7
16.4
24.8
30.0
7.6
6.3
2.1
1.6
25.9
24.4
0.8
0.7
KEC International
Neutral
143
-
3,683
9,294
10,186
7.9
8.1
9.9
11.9
14.5
12.0
2.1
1.8
15.6
16.3
0.6
0.6
KEI Industries
Accumulate
136
153
1,054
2,574
2,921
10.4
10.0
10.1
11.8
13.4
11.5
2.4
2.0
17.7
17.4
0.6
0.5
Thermax
Neutral
819
-
9,757
5,421
5,940
7.3
7.3
25.7
30.2
31.9
27.1
3.9
3.5
12.2
13.1
1.7
1.5
VATech Wabag
Buy
488
681
2,661
3,136
3,845
8.9
9.1
26.0
35.9
18.8
13.6
2.3
2.0
13.4
15.9
0.8
0.6
Cement
ACC
Neutral
1,327
-
24,913
11,225
13,172
13.2
16.9
44.5
75.5
29.8
17.6
2.8
2.6
11.2
14.2
2.2
1.9
Ambuja Cements
Neutral
218
-
43,188
9,350
10,979
18.2
22.5
5.8
9.5
37.5
22.9
3.2
2.8
10.2
12.5
4.6
3.9
India Cements
Neutral
136
-
4,173
4,364
4,997
18.5
19.2
7.9
11.3
17.2
12.0
1.2
1.2
8.0
8.5
1.7
1.5
JK Cement
Neutral
711
-
4,967
4,398
5,173
15.5
17.5
31.2
55.5
22.8
12.8
2.7
2.4
12.0
15.5
1.7
1.4
J K Lakshmi Cement
Buy
359
565
4,227
2,913
3,412
14.5
19.5
7.5
22.5
47.9
16.0
2.9
2.5
12.5
18.0
2.0
1.7
Orient Cement
Buy
126
215
2,590
2,114
2,558
18.5
20.5
8.1
11.3
15.6
11.2
2.3
1.9
9.0
14.0
1.8
1.4
UltraTech Cement
Neutral
3,470
-
95,247
25,768
30,385
21.0
23.5
111.0
160.0
31.3
21.7
4.0
3.5
13.5
15.8
3.8
3.2
Construction
ITNL
Neutral
109
-
3,581
8,946
10,017
31.0
31.6
8.1
9.1
13.4
12.0
0.5
0.5
4.2
5.0
3.7
3.5
KNR Constructions
Neutral
183
-
2,573
1,385
1,673
14.7
14.0
41.2
48.5
4.4
3.8
0.8
0.7
14.9
15.2
1.9
1.6
Larsen & Toubro
Buy
1,415
1,634
131,932
111,017
124,908
11.0
11.0
61.1
66.7
23.2
21.2
2.8
2.6
13.1
12.9
2.2
2.1
Gujarat Pipavav Port
Neutral
136
-
6,582
705
788
52.2
51.7
5.0
5.6
27.2
24.3
2.7
2.4
11.2
11.2
9.0
7.6
Nagarjuna Const.
Neutral
80
-
4,431
8,842
9,775
9.1
8.8
5.3
6.4
15.0
12.5
1.2
1.1
8.2
9.1
0.7
0.6
PNC Infratech
Buy
105
143
2,696
2,350
2,904
13.1
13.2
9.0
8.8
11.7
11.9
0.4
0.4
15.9
13.9
1.3
1.0
Simplex Infra
Neutral
281
-
1,391
6,829
7,954
10.5
10.5
31.4
37.4
9.0
7.5
0.9
0.9
9.9
13.4
0.6
0.5
Power Mech Projects
Neutral
445
-
654
1,801
2,219
12.7
14.6
72.1
113.9
6.2
3.9
1.1
1.0
16.8
11.9
0.4
0.3
Sadbhav Engineering
Accumulate
271
298
4,656
3,598
4,140
10.3
10.6
9.0
11.9
30.2
22.8
3.2
2.8
9.9
11.9
1.6
1.3
NBCC
Neutral
258
-
15,492
7,428
9,549
7.9
8.6
8.2
11.0
31.5
23.5
1.6
1.2
28.2
28.7
1.8
1.3
MEP Infra
Neutral
42
-
678
1,877
1,943
30.6
29.8
3.0
4.2
13.9
9.9
6.7
4.5
0.6
0.6
1.7
1.6
Stock Watch
January 23, 2017
Company Name
Reco
CMP
Target
Mkt Cap
Sales ( Čcr )
OPM(%)
EPS (Č)
PER(x)
P/BV(x)
RoE(%)
EV/Sales(x)
(Č)
Price ( Č)
( Č cr )
FY17E
FY18E
FY17E
FY18E
FY17E
FY18E
FY17E
FY18E
FY17E
FY18E
FY17E
FY18E
FY17E
FY18E
Construction
SIPL
Neutral
100
-
3,529
1,036
1,252
65.5
66.2
(8.4)
(5.6)
3.8
4.3
(22.8)
(15.9)
11.6
9.7
Engineers India
Neutral
146
-
9,852
1,725
1,935
16.0
19.1
11.4
13.9
12.8
10.5
1.8
1.7
13.4
15.3
4.6
4.2
Financials
Axis Bank
Buy
451
580
107,736
46,932
53,575
3.5
3.4
32.4
44.6
13.9
10.1
1.8
1.6
13.6
16.5
-
-
Bank of Baroda
Neutral
154
-
35,530
19,980
23,178
1.8
1.8
11.5
17.3
13.4
8.9
1.5
1.3
8.3
10.1
-
-
Canara Bank
Neutral
273
-
14,797
15,225
16,836
1.8
1.8
14.5
28.0
18.8
9.7
1.3
1.1
5.8
8.5
-
-
Dewan Housing Finance Buy
272
350
8,530
2,225
2,688
2.9
2.9
29.7
34.6
9.2
7.9
1.5
1.3
16.1
16.8
-
-
Equitas Holdings
Buy
158
235
5,311
939
1,281
11.7
11.5
5.8
8.2
27.3
19.3
2.4
2.1
10.9
11.5
-
-
Federal Bank
Accumulate
78
85
13,412
8,259
8,995
3.0
3.0
4.3
5.6
18.1
13.9
1.5
1.4
8.5
10.1
-
-
HDFC
Neutral
1,237
-
196,020
11,475
13,450
3.4
3.4
45.3
52.5
27.3
23.6
5.3
4.7
20.2
20.5
-
-
HDFC Bank
Accumulate
1,237
1,350
315,716
46,097
55,433
4.5
4.5
58.4
68.0
21.2
18.2
3.7
3.1
18.8
18.6
-
-
ICICI Bank
Buy
263
315
153,318
42,800
44,686
3.1
3.3
18.0
21.9
14.6
12.0
2.0
1.8
11.1
12.3
-
-
Lakshmi Vilas Bank
Buy
138
174
2,646
3,339
3,799
2.7
2.8
11.0
14.0
12.6
9.9
1.3
1.2
11.2
12.7
-
-
LIC Housing Finance
Buy
517
630
26,091
3,712
4,293
2.6
2.5
39.0
46.0
13.3
11.2
2.5
2.1
19.9
20.1
-
-
Punjab Natl.Bank
Neutral
128
-
27,249
23,532
23,595
2.3
2.4
6.8
12.6
18.8
10.2
2.9
2.1
3.3
6.5
-
-
RBL Bank
Neutral
369
-
13,633
1,783
2,309
2.6
2.6
12.7
16.4
29.0
22.5
3.2
2.8
12.8
13.3
-
-
South Ind.Bank
Neutral
21
-
2,845
6,435
7,578
2.5
2.5
2.7
3.1
7.8
6.8
1.0
0.8
10.1
11.2
-
-
St Bk of India
Neutral
251
-
194,846
88,650
98,335
2.6
2.6
13.5
18.8
18.6
13.4
1.8
1.6
7.0
8.5
-
-
Union Bank
Neutral
136
-
9,329
13,450
14,925
2.3
2.3
25.5
34.5
5.3
3.9
0.8
0.7
7.5
10.2
-
-
Yes Bank
Neutral
1,359
-
57,468
8,978
11,281
3.3
3.4
74.0
90.0
18.4
15.1
3.5
3.0
17.0
17.2
-
-
FMCG
Asian Paints
Neutral
966
-
92,639
17,128
18,978
16.8
16.4
19.1
20.7
50.6
46.7
17.6
16.6
34.8
35.5
5.3
4.8
Britannia
Buy
3,082
3,626
36,979
9,594
11,011
14.6
14.9
80.3
94.0
38.4
32.8
15.8
12.2
41.2
-
3.7
3.2
Colgate
Accumulate
901
995
24,495
4,605
5,149
23.4
23.4
23.8
26.9
37.8
33.5
20.9
16.4
64.8
66.8
5.2
4.7
Dabur India
Accumulate
276
304
48,539
8,315
9,405
19.8
20.7
8.1
9.2
34.0
30.0
9.5
7.9
31.6
31.0
5.5
4.8
GlaxoSmith Con*
Neutral
5,012
-
21,077
4,350
4,823
21.2
21.4
179.2
196.5
28.0
25.5
7.4
6.3
27.1
26.8
4.2
3.7
Godrej Consumer
Neutral
1,544
-
52,577
10,235
11,428
18.4
18.6
41.1
44.2
37.6
34.9
8.3
7.0
24.9
24.8
5.2
4.6
HUL
Neutral
861
-
186,366
35,252
38,495
17.8
17.8
20.7
22.4
41.7
38.5
39.9
34.2
95.6
88.9
5.1
4.7
ITC
Accumulate
255
284
309,640
40,059
44,439
38.3
39.2
9.0
10.1
28.5
25.2
7.9
6.9
27.8
27.5
7.2
6.5
Marico
Buy
255
300
32,963
6,430
7,349
18.8
19.5
6.4
7.7
39.9
33.2
12.1
10.1
33.2
32.5
4.9
4.3
Nestle*
Neutral
5,891
-
56,802
10,073
11,807
20.7
21.5
124.8
154.2
47.2
38.2
19.4
17.4
34.8
36.7
5.5
4.6
Stock Watch
January 23, 2017
Company Name
Reco
CMP
Target
Mkt Cap
Sales ( Čcr )
OPM(%)
EPS (Č)
PER(x)
P/BV(x)
RoE(%)
EV/Sales(x)
(Č)
Price ( Č)
( Č cr )
FY17E FY18E
FY17E
FY18E
FY17E
FY18E
FY17E
FY18E
FY17E
FY18E
FY17E
FY18E
FY17E
FY18E
FMCG
Tata Global
Neutral
126
-
7,977
8,675
9,088
9.8
9.8
7.4
8.2
17.1
15.4
1.9
1.9
7.9
8.1
0.8
0.8
Procter & Gamble
Accumulate
6,999
7,369
22,721
2,939
3,342
23.2
23.0
146.2
163.7
47.9
42.8
107.2
102.8
25.3
23.5
7.3
6.3
Hygiene
IT
HCL Tech^
Buy
839
1,000
118,329
49,242
57,168
20.5
20.5
55.7
64.1
15.1
13.1
3.1
2.3
20.3
17.9
2.3
1.8
Infosys
Buy
949
1,249
217,934
68,350
77,326
27.0
27.0
62.5
69.4
15.2
13.7
3.2
3.0
21.3
21.6
2.6
2.3
TCS
Accumulate
2,287
2,620
450,726
119,025
133,308
27.6
27.6
131.2
145.5
17.4
15.7
5.7
5.2
32.4
33.1
3.6
3.1
Tech Mahindra
Buy
469
600
45,654
29,673
32,937
15.5
17.0
32.8
39.9
14.3
11.8
2.8
2.4
19.6
20.7
1.3
1.1
Wipro
Buy
477
590
116,026
55,440
60,430
18.1
18.1
35.9
39.9
13.3
12.0
2.4
2.2
19.0
19.3
1.8
1.7
Media
D B Corp
Neutral
360
-
6,627
2,297
2,590
27.4
28.2
21.0
23.4
17.2
15.4
4.0
3.5
23.7
23.1
2.7
2.3
HT Media
Neutral
80
-
1,864
2,693
2,991
12.6
12.9
7.9
9.0
10.1
8.9
0.9
0.8
7.8
8.3
0.3
0.2
Jagran Prakashan
Buy
178
225
5,821
2,355
2,635
28.0
28.0
10.8
12.5
16.5
14.3
3.6
3.1
21.7
21.7
2.5
2.2
Sun TV Network
Neutral
519
-
20,449
2,850
3,265
70.1
71.0
26.2
30.4
19.8
17.1
5.1
4.5
24.3
25.6
6.8
5.8
Hindustan Media
Neutral
267
-
1,962
1,016
1,138
24.3
25.2
27.3
30.1
9.8
8.9
1.9
1.7
16.2
15.8
1.3
1.1
Ventures
TV Today Network
Buy
275
385
1,642
637
743
27.5
27.5
18.4
21.4
15.0
12.9
2.6
2.2
17.4
17.2
2.2
1.8
Metals & Mining
Coal India
Neutral
304
-
188,550
84,638
94,297
21.4
22.3
24.5
27.1
12.4
11.2
5.2
4.9
42.6
46.0
1.7
1.6
Hind. Zinc
Neutral
288
-
121,647
14,252
18,465
55.9
48.3
15.8
21.5
18.2
13.4
3.0
2.6
17.0
20.7
8.5
6.6
Hindalco
Neutral
171
-
35,424
107,899
112,095
7.4
8.2
9.2
13.0
18.6
13.2
0.9
0.9
4.8
6.6
0.9
0.8
JSW Steel
Neutral
186
-
44,972
53,201
58,779
16.1
16.2
130.6
153.7
1.4
1.2
0.2
0.2
14.0
14.4
1.6
1.4
NMDC
Neutral
142
-
44,769
6,643
7,284
44.4
47.7
7.1
7.7
19.9
18.4
1.7
1.7
8.8
9.2
4.5
4.1
SAIL
Neutral
58
-
24,058
47,528
53,738
(0.7)
2.1
(1.9)
2.6
22.4
0.6
0.6
(1.6)
3.9
1.4
1.2
Vedanta
Neutral
239
-
70,723
71,744
81,944
19.2
21.7
13.4
20.1
17.8
11.9
1.5
1.4
8.4
11.3
1.4
1.1
Tata Steel
Neutral
455
-
44,151
121,374
121,856
7.2
8.4
18.6
34.3
24.4
13.3
1.5
1.4
6.1
10.1
1.0
1.0
Oil & Gas
Cairn India
Neutral
263
-
49,391
9,127
10,632
4.3
20.6
8.8
11.7
29.9
22.5
1.0
0.9
3.3
4.2
6.9
5.7
GAIL
Neutral
460
-
58,331
56,220
65,198
9.3
10.1
27.1
33.3
17.0
13.8
1.6
1.5
9.3
10.7
1.2
1.0
ONGC
Neutral
197
-
253,328
137,222
152,563
15.0
21.8
19.5
24.1
10.1
8.2
0.9
0.8
8.5
10.1
2.1
1.9
Indian Oil Corp
Neutral
352
-
171,098
373,359
428,656
5.9
5.5
54.0
59.3
6.5
5.9
1.0
0.9
16.0
15.6
0.6
0.5
Reliance Industries
Neutral
1,026
-
332,695
301,963
358,039
12.1
12.6
87.7
101.7
11.7
10.1
1.2
1.1
10.7
11.3
1.6
1.3
Pharmaceuticals
Alembic Pharma
Neutral
594
-
11,195
3,483
4,083
20.2
21.4
24.3
30.4
24.4
19.5
5.6
4.4
25.5
25.3
3.2
2.6
Alkem Laboratories Ltd
Buy
1,646
1,989
19,674
6,043
6,893
18.7
19.3
80.5
88.8
20.4
18.5
4.6
3.8
22.3
20.3
3.2
2.8
Aurobindo Pharma
Buy
699
877
40,906
15,720
18,078
23.7
23.7
41.4
47.3
16.9
14.8
4.4
3.4
29.6
26.1
2.8
2.4
Stock Watch
January 23, 2017
Company Name
Reco
CMP
Target
Mkt Cap
Sales ( Čcr )
OPM(%)
EPS (Č)
PER(x)
P/BV(x)
RoE(%)
EV/Sales(x)
(Č)
Price ( Č)
( Č cr )
FY17E FY18E
FY17E
FY18E
FY17E
FY18E
FY17E
FY18E
FY17E
FY18E
FY17E
FY18E
FY17E
FY18E
Pharmaceuticals
Aventis*
Neutral
4,134
-
9,521
2,277
2,597
17.3
18.3
149.4
172.0
27.7
24.0
4.6
3.7
25.1
28.8
3.9
3.1
Cadila Healthcare
Accumulate
359
400
36,778
10,429
12,318
22.6
22.0
16.9
19.2
21.3
18.7
5.4
4.3
28.5
25.7
3.5
2.9
Cipla
Reduce
576
490
46,322
15,378
18,089
17.4
18.4
21.6
27.2
26.7
21.2
3.5
3.0
13.7
15.2
3.2
2.7
Dr Reddy's
Neutral
2,946
-
48,810
16,043
18,119
20.8
22.4
112.4
142.9
26.2
20.6
3.5
3.1
14.1
15.9
3.0
2.7
Dishman Pharma
Neutral
231
-
3,727
1,718
1,890
22.7
22.8
9.5
11.3
24.3
20.4
2.4
2.1
10.1
10.9
2.6
2.3
GSK Pharma*
Neutral
2,752
-
23,311
3,000
3,312
15.4
20.6
46.5
60.8
59.2
45.3
14.2
14.2
26.3
30.6
7.5
6.8
Indoco Remedies
Reduce
273
240
2,519
1,112
1,289
16.2
18.2
11.6
16.0
23.6
17.1
3.8
3.2
17.0
20.1
2.4
2.0
Ipca labs
Accumulate
556
613
7,018
3,303
3,799
15.3
15.3
17.3
19.7
32.2
28.2
2.8
2.6
9.1
9.4
2.3
2.0
Lupin
Buy
1,462
1,809
65,987
15,912
18,644
26.4
26.7
58.1
69.3
25.2
21.1
4.9
4.0
21.4
20.9
4.2
3.5
Sun Pharma
Buy
641
847
153,765
31,129
35,258
32.0
32.9
30.2
35.3
21.2
18.2
3.5
2.9
20.0
20.1
4.5
3.8
Power
Tata Power
Neutral
78
-
20,976
36,916
39,557
17.4
27.1
5.1
6.3
15.2
12.3
1.3
1.2
9.0
10.3
1.6
1.4
NTPC
Neutral
171
-
140,585
86,605
95,545
17.5
20.8
11.8
13.4
14.5
12.7
1.5
1.4
10.5
11.1
3.0
3.0
Power Grid
Accumulate
199
223
104,135
25,315
29,193
88.2
88.7
14.2
17.2
14.1
11.6
2.1
1.9
15.2
16.1
8.8
7.9
Real Estate
Prestige Estate
Buy
164
210
6,133
4,707
5,105
25.2
26.0
10.3
13.0
15.9
12.6
1.3
1.2
10.3
10.2
2.5
2.2
MLIFE
Buy
360
522
1,478
1,152
1,300
22.7
24.6
29.9
35.8
12.1
10.1
0.9
0.8
7.6
8.6
2.0
1.7
Telecom
Bharti Airtel
Neutral
321
-
128,197
105,086
114,808
34.5
34.7
12.2
16.4
26.3
19.6
1.8
1.7
6.8
8.4
2.1
1.9
Idea Cellular
Neutral
71
-
25,713
40,133
43,731
37.2
37.1
6.4
6.5
11.2
11.0
0.9
0.9
8.2
7.6
1.7
1.4
zOthers
Abbott India
Neutral
4,404
-
9,358
3,153
3,583
14.1
14.4
152.2
182.7
28.9
24.1
142.1
121.3
25.6
26.1
2.7
2.3
Asian Granito
Buy
253
351
761
1,071
1,182
12.1
12.4
12.7
16.0
19.9
15.8
1.9
1.7
9.5
10.7
1.0
0.9
Bajaj Electricals
Buy
228
274
2,308
4,801
5,351
5.7
6.2
10.4
13.7
21.9
16.7
2.7
2.4
12.4
14.5
0.5
0.4
Banco Products (India)
Neutral
207
-
1,483
1,353
1,471
12.3
12.4
14.5
16.3
14.3
12.7
19.8
17.8
14.5
14.6
1.0
111.2
Coffee Day Enterprises
Neutral
197
-
4,066
2,964
3,260
20.5
21.2
4.7
8.0
-
24.7
2.3
2.1
5.5
8.5
1.8
1.6
Ltd
Competent Automobiles Neutral
162
-
100
1,137
1,256
3.1
2.7
28.0
23.6
5.8
6.9
31.2
28.2
14.3
11.5
0.1
0.1
Elecon Engineering
Neutral
57
-
643
1,482
1,660
13.7
14.5
3.9
5.8
14.7
9.9
3.5
3.2
7.8
10.9
0.8
0.7
Finolex Cables
Neutral
411
-
6,280
2,883
3,115
12.0
12.1
14.2
18.6
28.9
22.1
15.4
13.4
15.8
14.6
1.9
1.7
Garware Wall Ropes
Neutral
618
-
1,352
873
938
14.3
14.3
35.2
37.5
17.6
16.5
3.1
2.6
17.5
15.9
1.5
1.3
Goodyear India*
Neutral
714
-
1,646
1,598
1,704
10.4
10.2
49.4
52.6
14.5
13.6
66.7
58.5
18.2
17.0
0.7
99.3
Hitachi
Neutral
1,453
-
3,952
2,081
2,433
8.8
8.9
33.4
39.9
43.5
36.4
35.1
29.3
22.1
21.4
1.9
1.6
HSIL
Neutral
291
-
2,103
2,384
2,515
15.8
16.3
15.3
19.4
19.0
15.0
18.9
16.3
7.8
9.3
1.1
1.0
Stock Watch
January 23, 2017
Company Name
Reco
CMP
Target
Mkt Cap
Sales ( Čcr )
OPM(%)
EPS (Č)
PER(x)
P/BV(x)
RoE(%)
EV/Sales(x)
(Č)
Price ( Č)
( Č cr )
FY17E
FY18E
FY17E
FY18E
FY17E
FY18E
FY17E
FY18E
FY17E
FY18E
FY17E
FY18E
FY17E
FY18E
zOthers
Interglobe Aviation
Neutral
926
-
33,461
21,122
26,005
14.5
27.6
110.7
132.1
8.4
7.0
50.0
35.7
168.5
201.1
1.6
1.2
Jyothy Laboratories
Neutral
345
-
6,259
1,440
2,052
11.5
13.0
8.5
10.0
40.6
34.5
9.8
9.1
18.6
19.3
4.6
3.2
Kirloskar Engines India
Neutral
331
-
4,780
2,554
2,800
9.9
10.0
10.5
12.1
31.5
27.3
13.2
12.4
10.7
11.7
1.5
1.3
Ltd
Linc Pen & Plastics
Neutral
281
-
416
382
420
9.3
9.5
13.5
15.7
20.9
17.9
3.6
3.1
17.1
17.3
1.2
1.0
M M Forgings
Neutral
465
-
561
546
608
20.4
20.7
41.3
48.7
11.3
9.6
63.7
56.4
16.6
17.0
0.9
0.8
Manpasand Bever.
Neutral
602
-
3,446
836
1,087
19.6
19.4
16.9
23.8
35.7
25.3
4.3
3.7
12.0
14.8
3.9
2.9
Mirza International
Buy
90
107
1,086
987
1,106
18.0
18.0
6.5
7.6
13.8
11.9
2.2
1.9
15.9
15.7
1.3
1.2
MT Educare
Neutral
132
-
527
366
417
17.7
18.2
9.4
10.8
14.1
12.2
3.1
2.7
22.2
22.3
1.3
1.2
Narayana Hrudaya
Neutral
338
-
6,901
1,873
2,166
11.5
11.7
2.6
4.0
127.7
85.2
7.8
7.1
6.1
8.3
3.8
3.3
Navkar Corporation
Buy
176
265
2,516
369
561
42.9
42.3
7.2
11.5
24.4
15.3
1.8
1.6
7.4
10.5
7.8
5.1
Navneet Education
Neutral
124
-
2,953
1,062
1,147
24.0
24.0
6.1
6.6
20.4
18.7
4.2
3.7
20.6
19.8
2.9
2.6
Nilkamal
Neutral
1,468
-
2,191
1,995
2,165
10.7
10.4
69.8
80.6
21.0
18.2
83.9
72.9
16.6
16.5
1.1
1.0
Page Industries
Neutral
14,250
-
15,894
2,450
3,124
20.1
17.6
299.0
310.0
47.7
46.0
317.4
242.3
47.1
87.5
6.5
5.2
Parag Milk Foods
Neutral
260
-
2,190
1,919
2,231
9.3
9.6
9.5
12.9
27.6
20.1
4.3
3.5
15.5
17.5
1.3
1.1
Quick Heal
Neutral
268
-
1,876
408
495
27.3
27.0
7.7
8.8
34.6
30.4
3.2
3.2
9.3
10.6
3.7
3.1
Radico Khaitan
Buy
116
147
1,545
1,667
1,824
13.0
13.2
6.7
8.2
17.5
14.2
1.6
1.4
9.0
10.2
1.3
1.2
Relaxo Footwears
Neutral
416
-
4,997
2,085
2,469
9.2
8.2
7.6
8.0
55.0
52.3
21.3
18.2
17.9
18.8
2.5
2.1
S H Kelkar & Co.
Neutral
318
-
4,599
1,036
1,160
15.1
15.0
6.1
7.2
52.1
44.3
5.6
5.1
10.7
11.5
4.3
3.8
Siyaram Silk Mills
Accumulate
1,387
1,605
1,300
1,733
1,948
11.6
11.7
96.6
114.7
14.4
12.1
2.2
1.9
15.3
15.7
1.0
0.8
Styrolution ABS India*
Neutral
603
-
1,060
1,440
1,537
9.2
9.0
40.6
42.6
14.9
14.2
37.9
34.5
12.3
11.6
0.7
0.6
Surya Roshni
Neutral
184
-
804
3,342
3,625
7.8
7.5
17.3
19.8
10.6
9.3
20.2
16.2
10.5
10.8
0.5
0.5
Team Lease Serv.
Neutral
871
-
1,489
3,229
4,001
1.5
1.8
22.8
32.8
38.3
26.5
4.1
3.6
10.7
13.4
0.4
0.3
The Byke Hospitality
Neutral
166
-
664
287
384
20.5
20.5
7.6
10.7
21.8
15.5
4.6
3.7
20.7
23.5
2.3
1.7
Transport Corporation of
Neutral
159
-
1,217
2,671
2,911
8.5
8.8
13.9
15.7
11.5
10.2
1.6
1.4
13.7
13.8
0.6
0.5
India
TVS Srichakra
Neutral
3,201
-
2,451
2,304
2,614
13.7
13.8
231.1
266.6
13.9
12.0
359.7
283.2
33.9
29.3
1.1
0.9
UFO Moviez
Neutral
408
-
1,125
619
685
33.2
33.4
30.0
34.9
13.6
11.7
1.9
1.6
13.8
13.9
1.5
1.2
Visaka Industries
Neutral
201
-
319
1,051
1,138
10.3
10.4
21.0
23.1
9.6
8.7
25.8
24.2
9.0
9.2
0.6
0.5
VRL Logistics
Neutral
293
-
2,676
1,902
2,119
16.7
16.6
14.6
16.8
20.1
17.4
4.4
3.9
21.9
22.2
1.5
1.3
Wonderla Holidays
Neutral
354
-
1,998
287
355
38.0
40.0
11.3
14.2
31.3
24.9
4.5
3.9
21.4
23.9
6.6
5.4
Source: Company, Angel Research; Note: *December year end; #September year end; &October year end; Price as on January 20, 2017
Market Outlook
January 23, 2017
Research Team Tel: 022 - 39357800
DISCLAIMER
Angel Broking Private Limited (hereinafter referred to as “Angel”) is a registered Member of National Stock Exchange of India
Limited,Bombay Stock Exchange Limited and Metropolitan Stock Exchange Limited. It is also registered as a Depository Participant with
CDSL and Portfolio Manager with SEBI. It also has registration with AMFI as a Mutual Fund Distributor. Angel Broking Private Limited is a
registered entity with SEBI for Research Analyst in terms of SEBI (Research Analyst) Regulations, 2014 vide registration number
INH000000164. Angel or its associates has not been debarred/ suspended by SEBI or any other regulatory authority for accessing
/dealing in securities Market. Angel or its associates/analyst has not received any compensation / managed or
co-managed public offering of securities of the company covered by Analyst during the past twelve months.
This document is solely for the personal information of the recipient, and must not be singularly used as the basis of any investment
decision. Nothing in this document should be construed as investment or financial advice. Each recipient of this document should make
such investigations as they deem necessary to arrive at an independent evaluation of an investment in the securities of the companies
referred to in this document (including the merits and risks involved), and should consult their own advisors to determine the merits and
risks of such an investment.
Reports based on technical and derivative analysis center on studying charts of a stock's price movement, outstanding positions and
trading volume, as opposed to focusing on a company's fundamentals and, as such, may not match with a report on a company's
fundamentals. Investors are advised to refer the Fundamental and Technical Research Reports available on our website to evaluate the
contrary view, if any.
The information in this document has been printed on the basis of publicly available information, internal data and other reliable
sources believed to be true, but we do not represent that it is accurate or complete and it should not be relied on as such, as this
document is for general guidance only. Angel Broking Pvt. Limited or any of its affiliates/ group companies shall not be in any way
responsible for any loss or damage that may arise to any person from any inadvertent error in the information contained in this report.
Angel Broking Pvt. Limited has not independently verified all the information contained within this document. Accordingly, we cannot
testify, nor make any representation or warranty, express or implied, to the accuracy, contents or data contained within this document.
While Angel Broking Pvt. Limited endeavors to update on a reasonable basis the information discussed in this material, there may be
regulatory, compliance, or other reasons that prevent us from doing so.
This document is being supplied to you solely for your information, and its contents, information or data may not be reproduced,
redistributed or passed on, directly or indirectly.
Neither Angel Broking Pvt. Limited, nor its directors, employees or affiliates shall be liable for any loss or damage that may arise from
or in connection with the use of this information.